Sunshine Quotas Across Europe
27 Feb, 2025
![]()
27 Feb, 2025

This week, something quite unusual is happening in London—the forecast shows an extended period of sunny days. Given how notoriously unpredictable and cloudy London weather can be, this feels like a rare treat. But as I stared at the forecast, I had a cheeky thought: are we using up our entire sunshine quota for the month in one go?
Curious about how much sunshine London usually gets, I dug up some historical data. In March last year, London had only 115 hours of sunshine. (Hopefully, this week's bright spell doesn’t mean gloomier days ahead!) As I explored the dataset, one thing caught my eye: Edinburgh enjoys more sunshine than Manchester. Having lived in Manchester for a year before moving to London, I can confirm it often feels like the rain is a permanent resident there. Interestingly, seeing Edinburgh, which is further north, getting more sunshine than Manchester was a bit surprising.
![]()
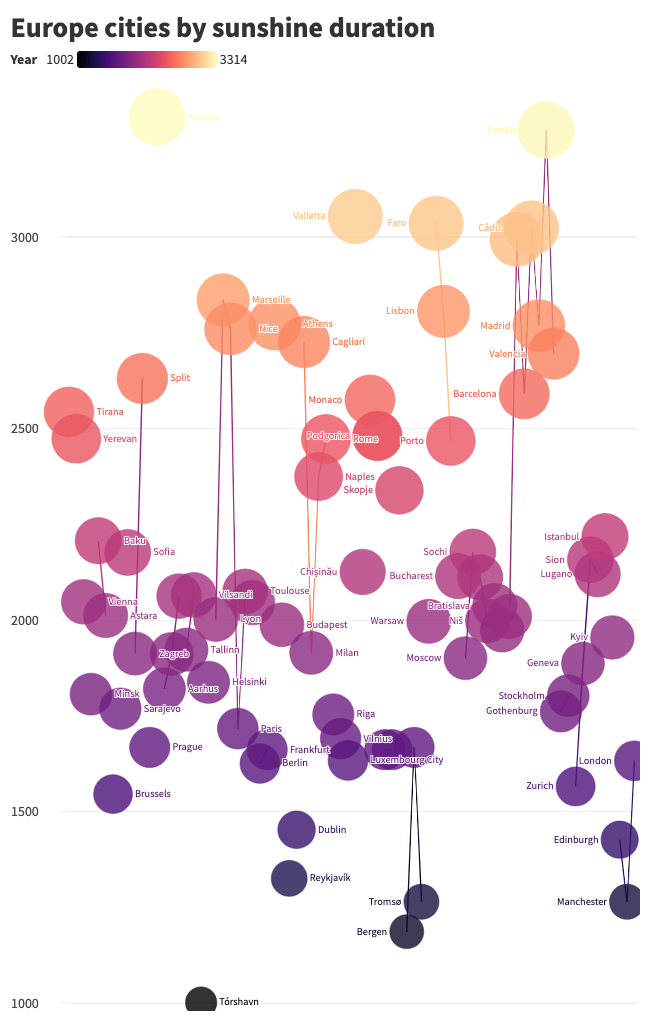
First attempt: cities were plotted by sunshine hours with connecting lines showing which country they belonged to. While visually engaging, this layout felt cluttered and made it harder to quickly compare cities from the same country. I kept the color gradient to represent sunshine hours, which helps retain the visual impact while improving clarity.
Curious about how much sunshine London usually gets, I dug up some historical data. In March last year, London had only 115 hours of sunshine. (Hopefully, this week's bright spell doesn’t mean gloomier days ahead!) As I explored the dataset, one thing caught my eye: Edinburgh enjoys more sunshine than Manchester. Having lived in Manchester for a year before moving to London, I can confirm it often feels like the rain is a permanent resident there. Interestingly, seeing Edinburgh, which is further north, getting more sunshine than Manchester was a bit surprising.
First attempt: cities were plotted by sunshine hours with connecting lines showing which country they belonged to. While visually engaging, this layout felt cluttered and made it harder to quickly compare cities from the same country. I kept the color gradient to represent sunshine hours, which helps retain the visual impact while improving clarity.
Another interesting comparison is that Reykjavik, the capital of Iceland, often associated with long, dark winters, competes quite well with some UK cities in terms of sunshine duration. This highlights how geographical location isn’t the sole factor—weather patterns and cloud cover play a significant role.
While looking into the European scope, the dataset reaffirmed some expected trends—Mediterranean cities such as Seville, Nice, and Athens enjoy significantly more sunshine. But it also surfaced some interesting comparisons: cities at similar latitudes can have vastly different sunshine durations. For example, despite being further north, some Baltic and Scandinavian cities receive more sunshine than parts of the UK, possibly due to differing weather patterns and cloud cover.
![]()
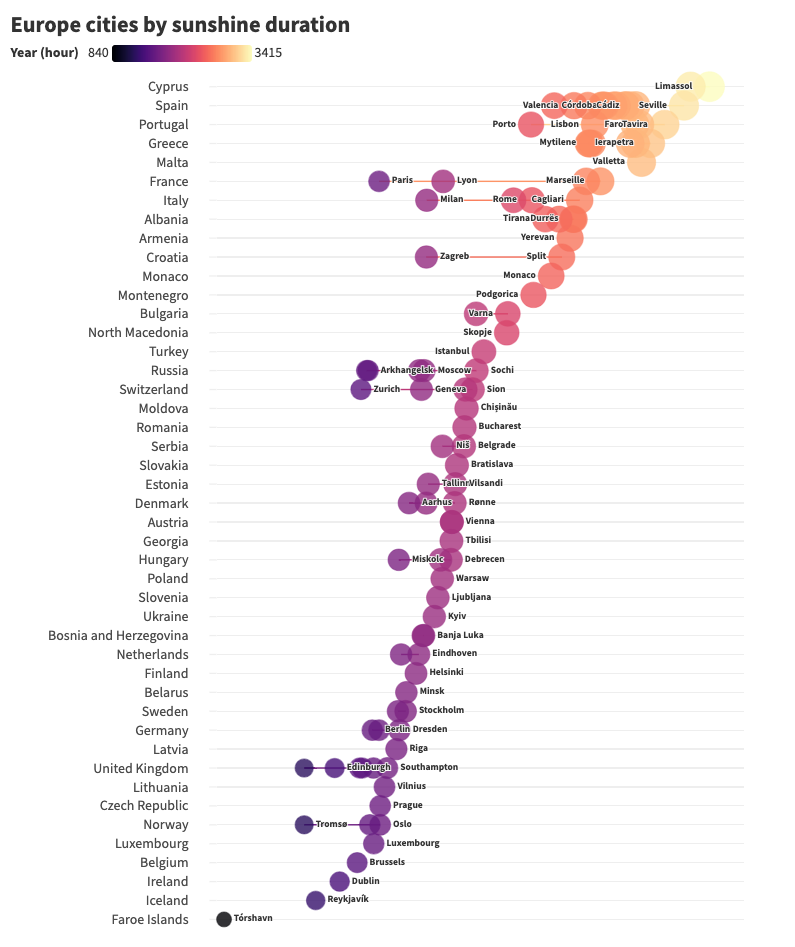
Final version: I reorganised the data so that cities are aligned by country along the vertical axis. This not only makes the national grouping more obvious, but also allows for direct, side-by-side comparisons. The new layout makes it easier to spot continental patterns—such as southern European countries clustering toward the top, and northern ones appearing lower down.
While looking into the European scope, the dataset reaffirmed some expected trends—Mediterranean cities such as Seville, Nice, and Athens enjoy significantly more sunshine. But it also surfaced some interesting comparisons: cities at similar latitudes can have vastly different sunshine durations. For example, despite being further north, some Baltic and Scandinavian cities receive more sunshine than parts of the UK, possibly due to differing weather patterns and cloud cover.
Final version: I reorganised the data so that cities are aligned by country along the vertical axis. This not only makes the national grouping more obvious, but also allows for direct, side-by-side comparisons. The new layout makes it easier to spot continental patterns—such as southern European countries clustering toward the top, and northern ones appearing lower down.
Europe’s Sunshine Champions
The visualisation of European cities' sunshine duration paints a clear picture: Southern Europe dominates in sunshine hours. Cities like Seville, Nicosia, and Madrid bask in the sun, comfortably sitting at the top of the chart, while the UK huddles towards the lower end.Interestingly, London doesn’t fare too badly compared to other northern European cities, such as those in Scandinavia and parts of Germany. However, it’s still far from a sun-lover’s paradise. The contrast between north and southern Europe is stark, with places like Valencia enjoying well over 3000 sunshine hours annually, while some northern cities struggle to reach even half that number.
Refining the Data Visualisation
The original dataset was quite cluttered, so I refined the graph by aligning cities within their respective countries. I also added a filter function, allowing users to explore cities within a specific country, making comparisons more intuitive and straightforward. The connections between cities of the same country remain, showing how each nation is distributed in terms of sunshine.If you're curious to see how your city fares in terms of sunshine, check out the dataset here: Wikipedia List of Cities by Sunshine Duration. And as for Londoners—let’s make the most of this rare sunny spell while it lasts!