Bumbing of the freshwater
Data visualisation/ poster design
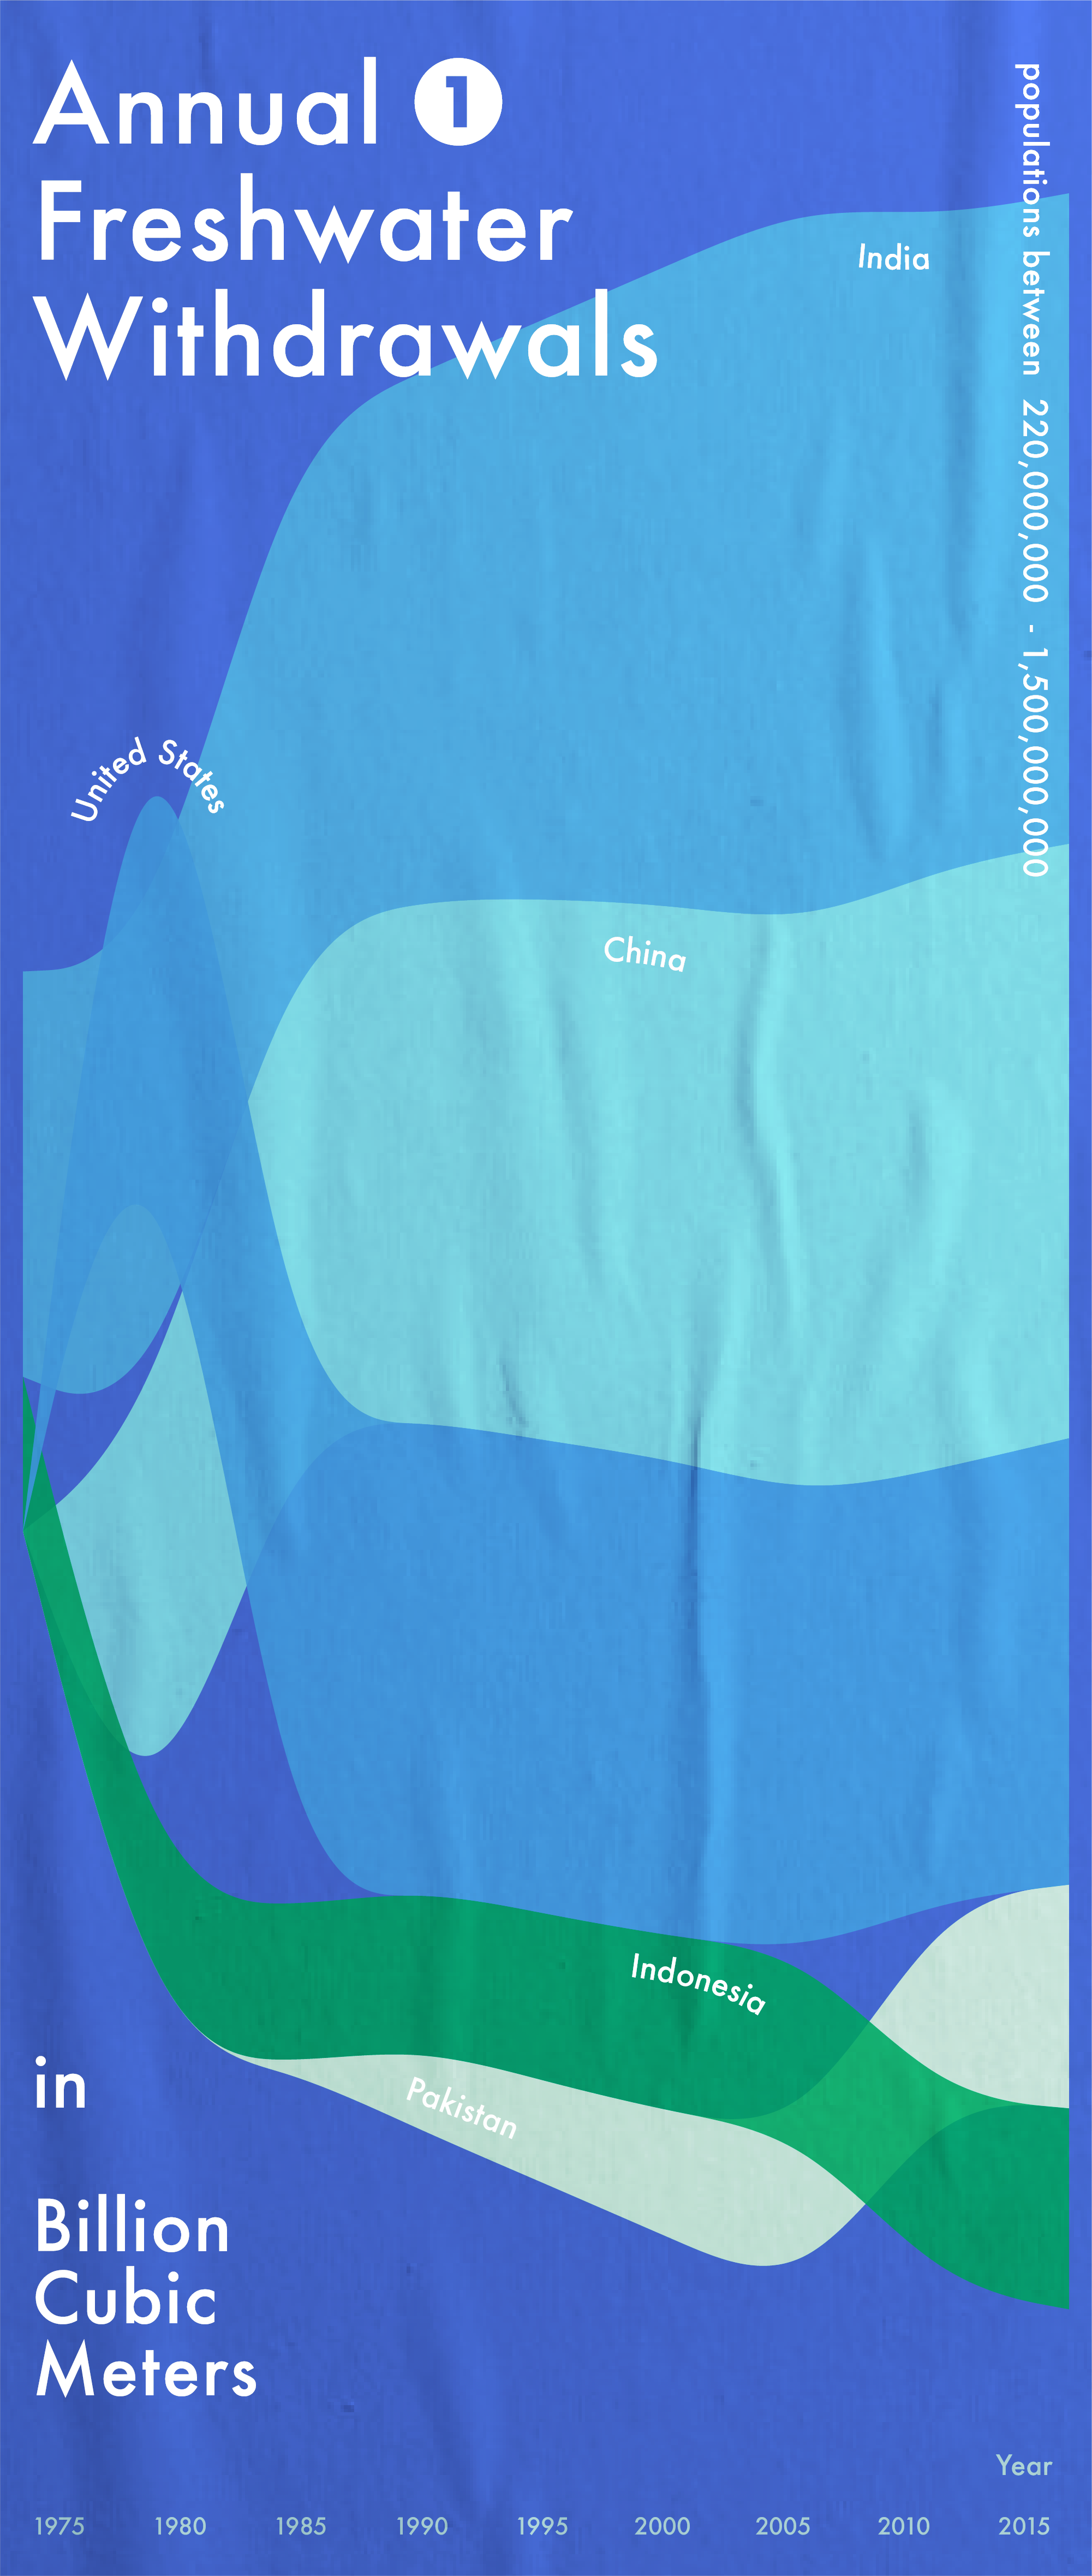
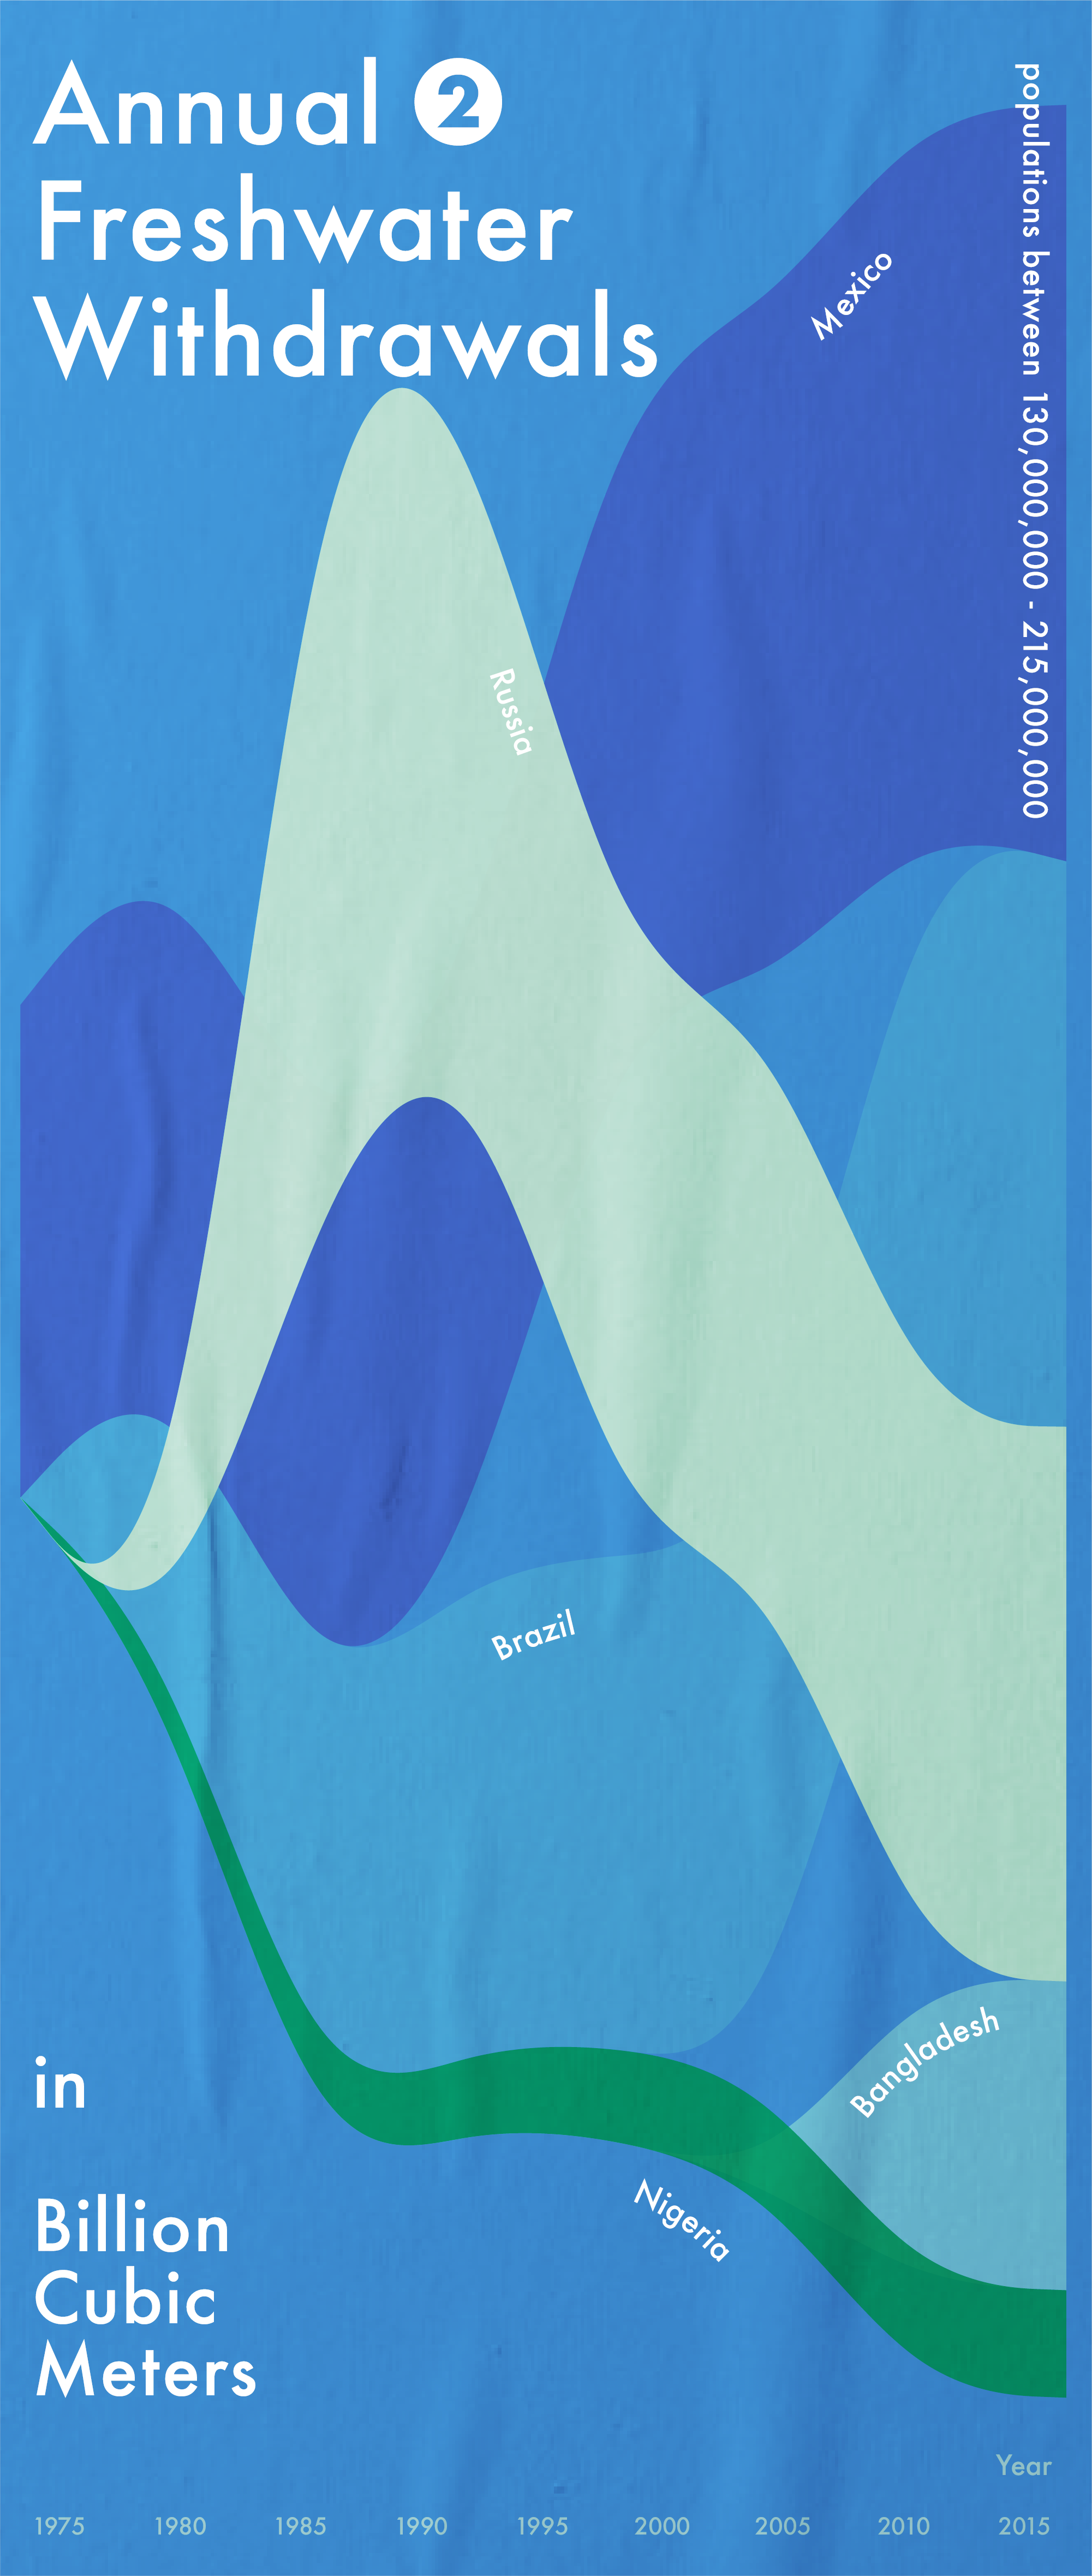
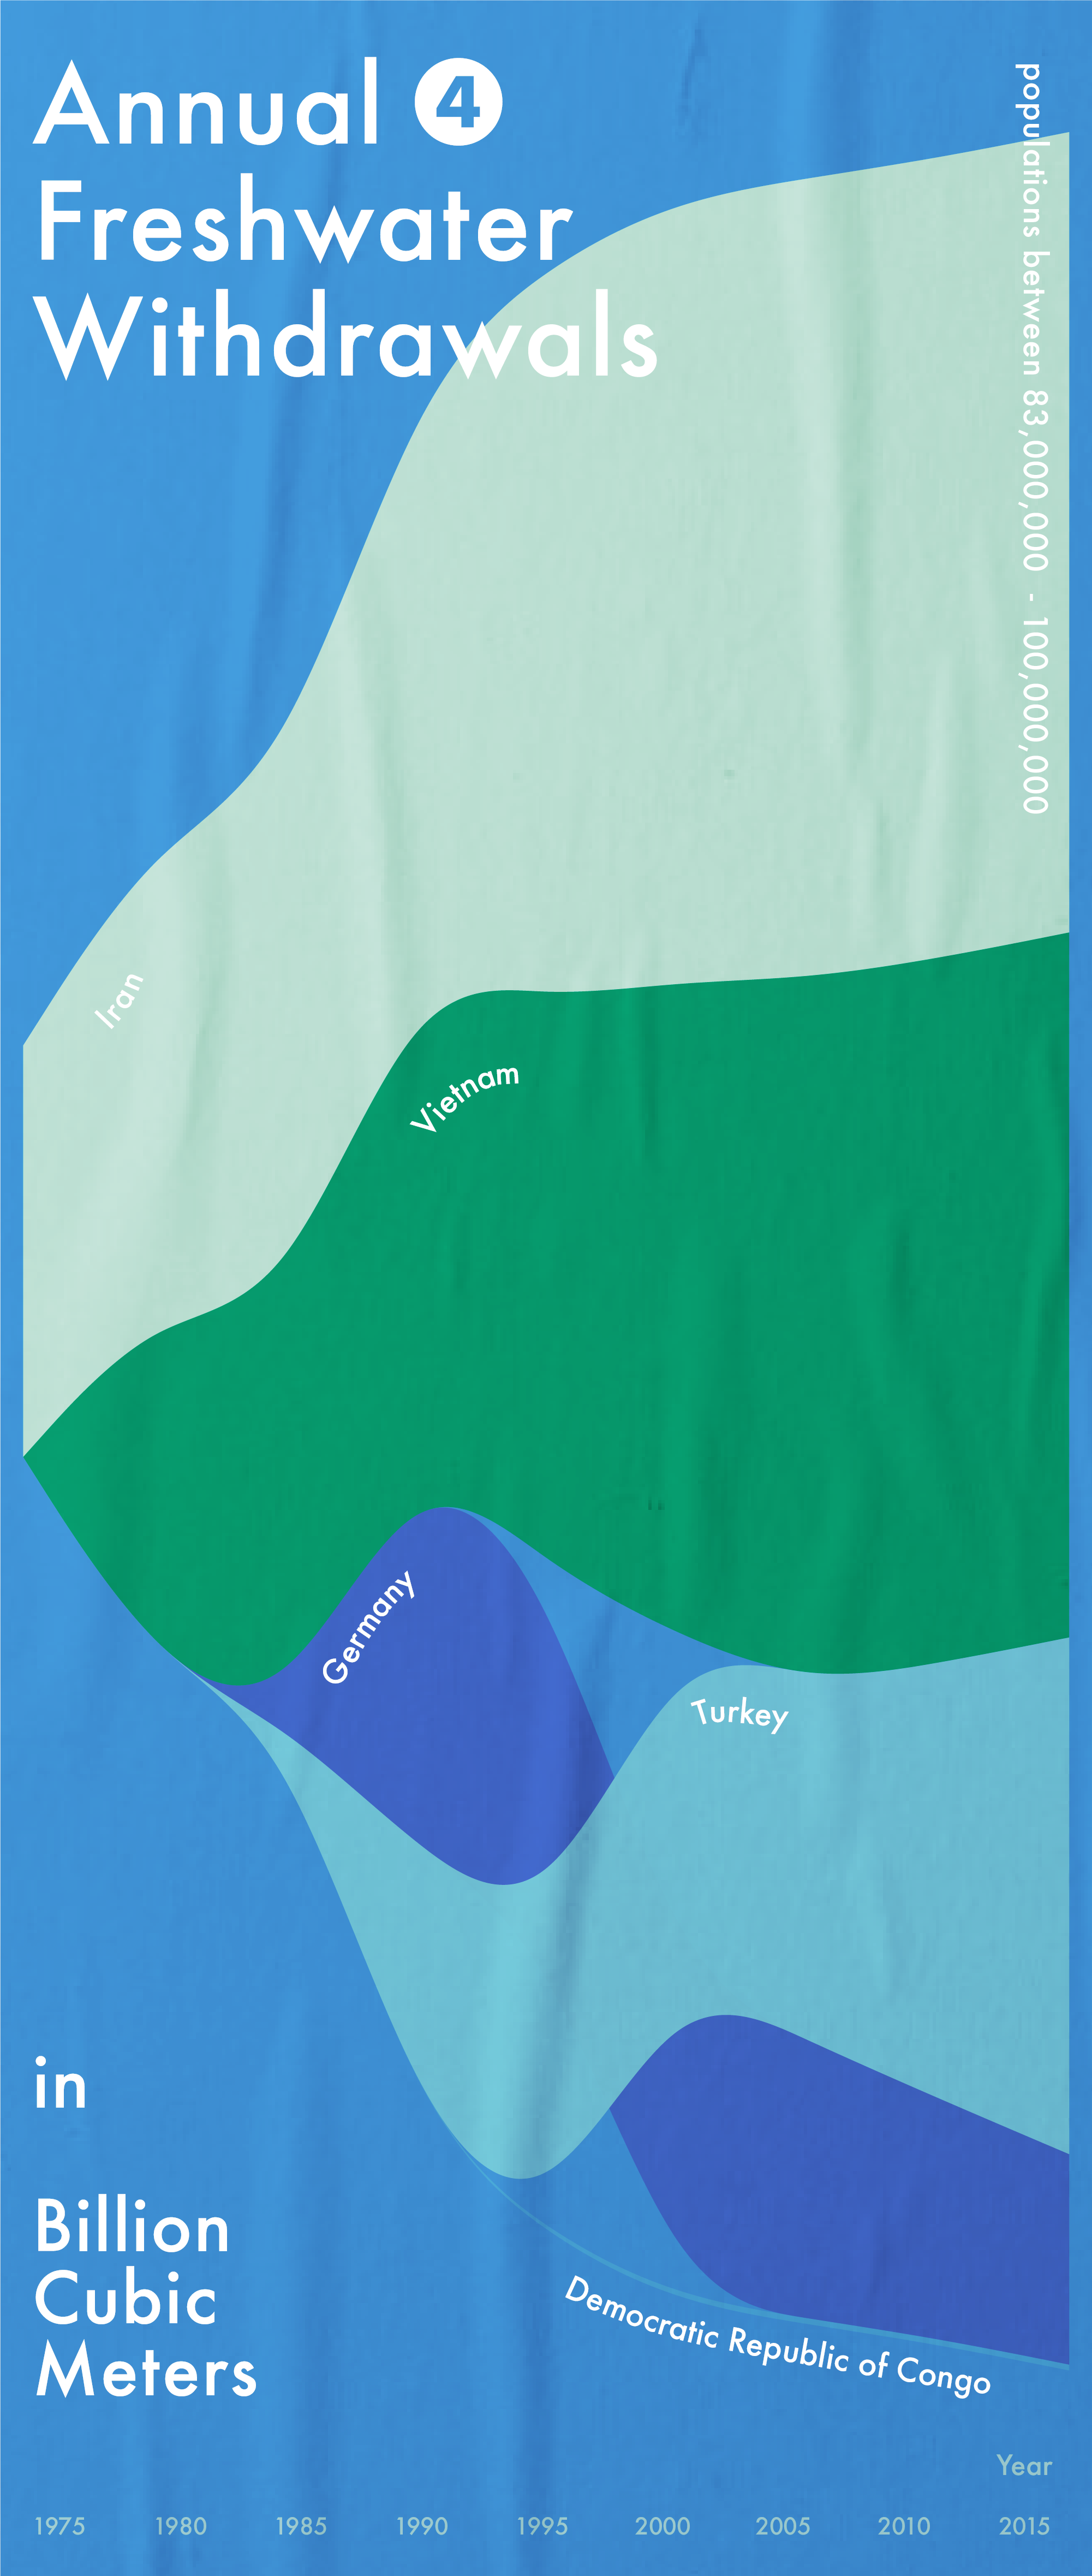
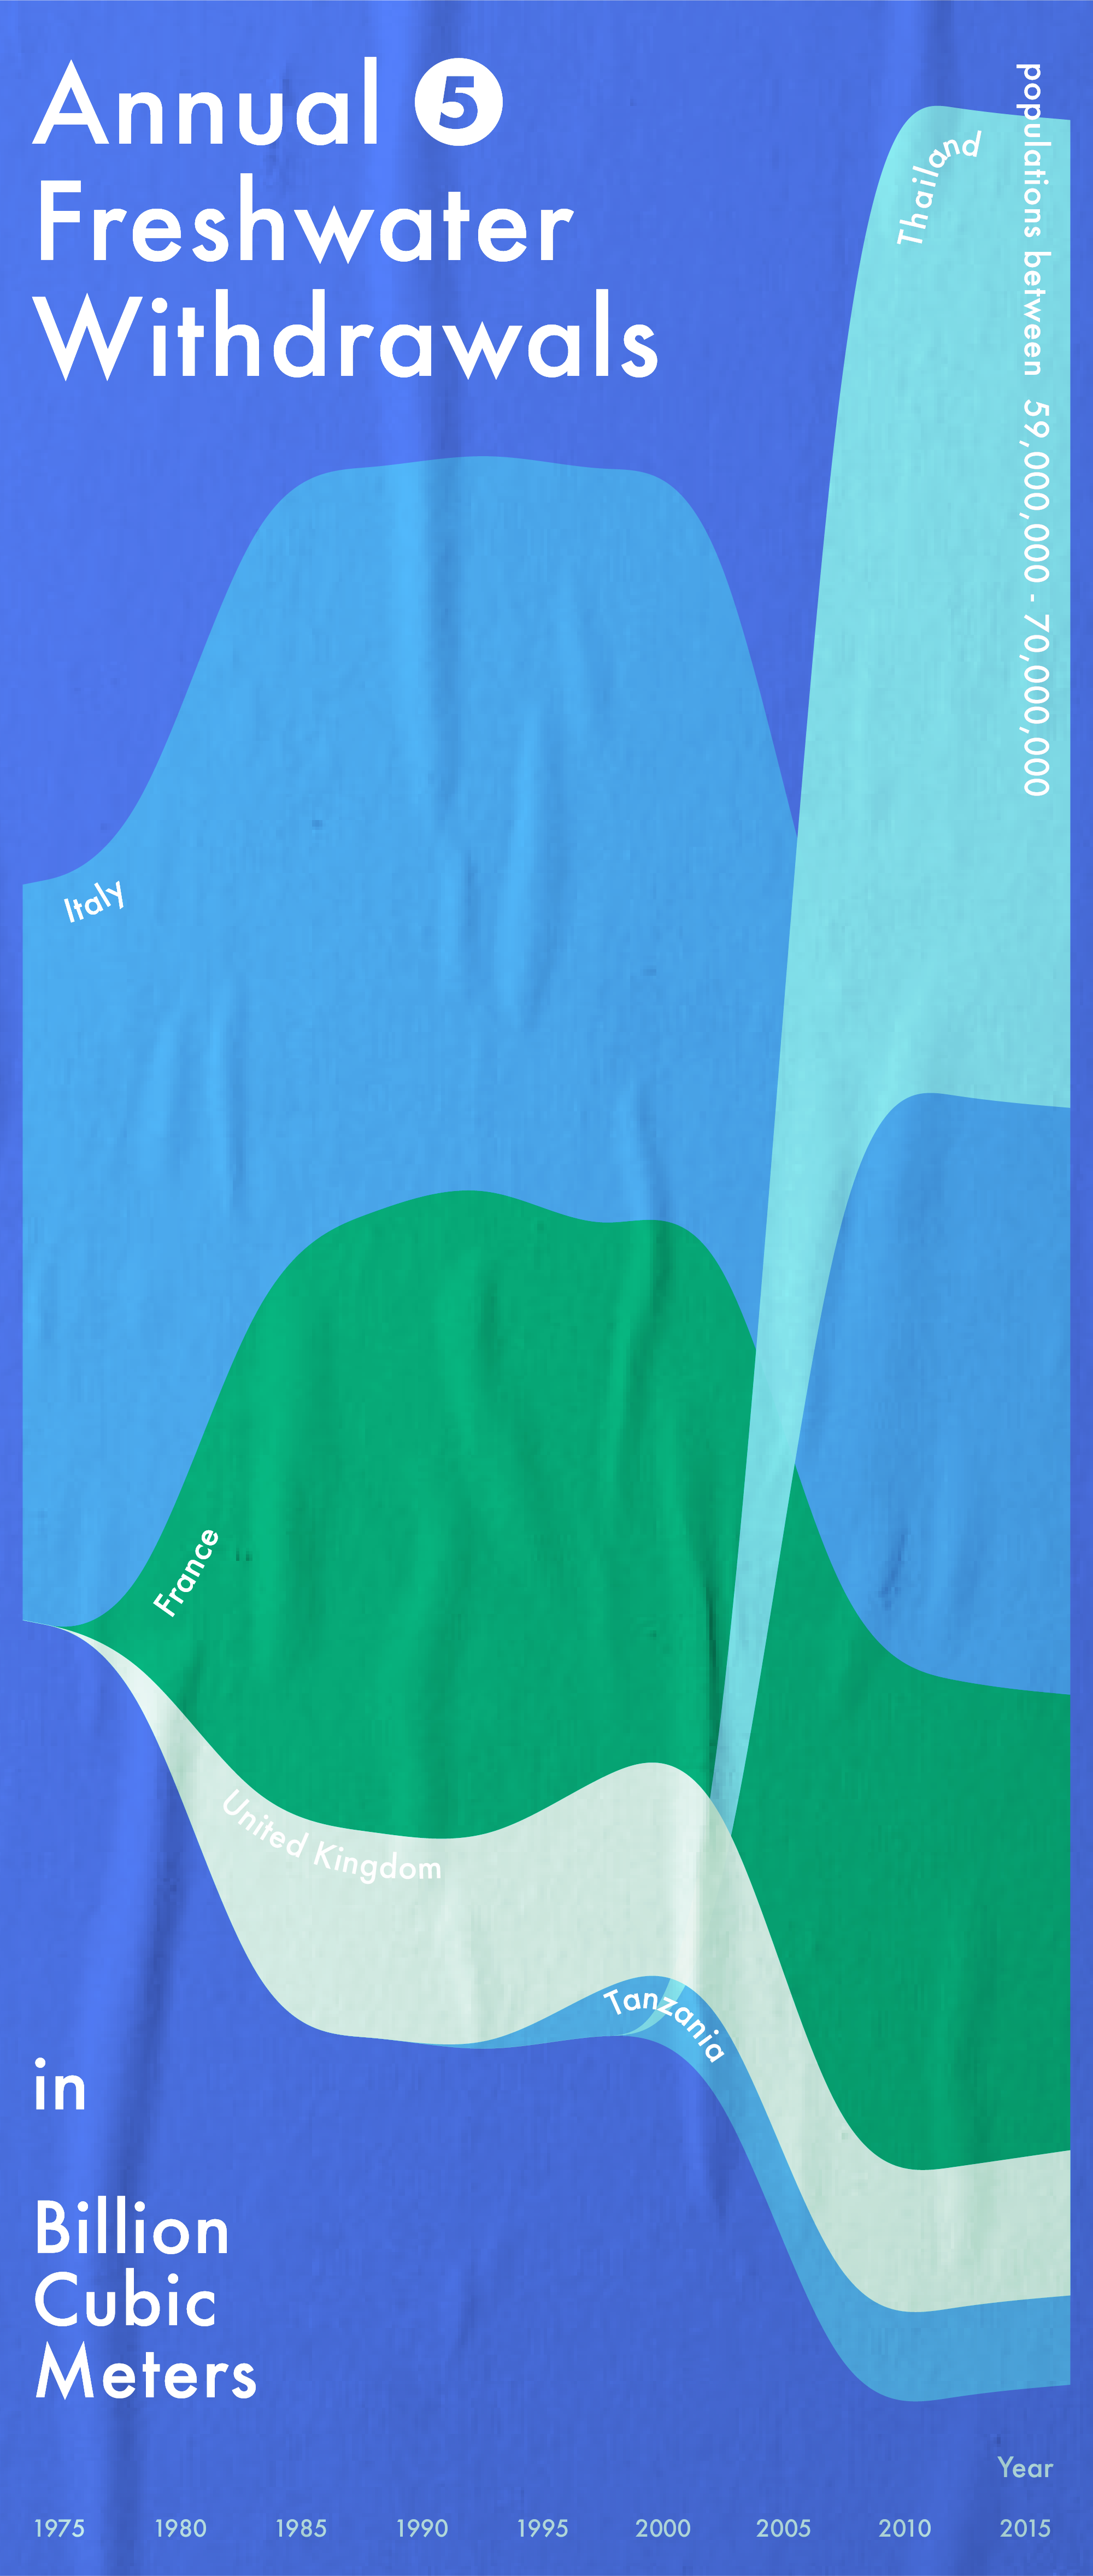
The set of posters features data visualisations which illustrate the patterns of freshwater withdrawal in the top 20 highest-population countries from the 1975 to the present. It reveals that while developed countries have decreased their freshwater usage, developing countries have increased theirs, and less developed countries have remained at the bottom. The bumpchart patterns suggest that the water inequality are unresolved over the years.


More to explore: